 Excel & CSV Exporter
 Analytics & Reports
Mixtable is an online spreadsheet, designed from the ground up to bulk edit and analyze Shopify data.
Got a question? We're here to help! Reach out at team@mixtable.com, and we'll get back
to you promptly.
Mixtable lets you change how columns display and behave in your spreadsheet. You can control how values appear, how they’re edited, and even turn columns into dropdowns for easier data entry.
When working with Shopify data, column formatting makes your spreadsheet cleaner and helps prevent errors—especially useful for prices, inventory counts, dates, and SKUs.
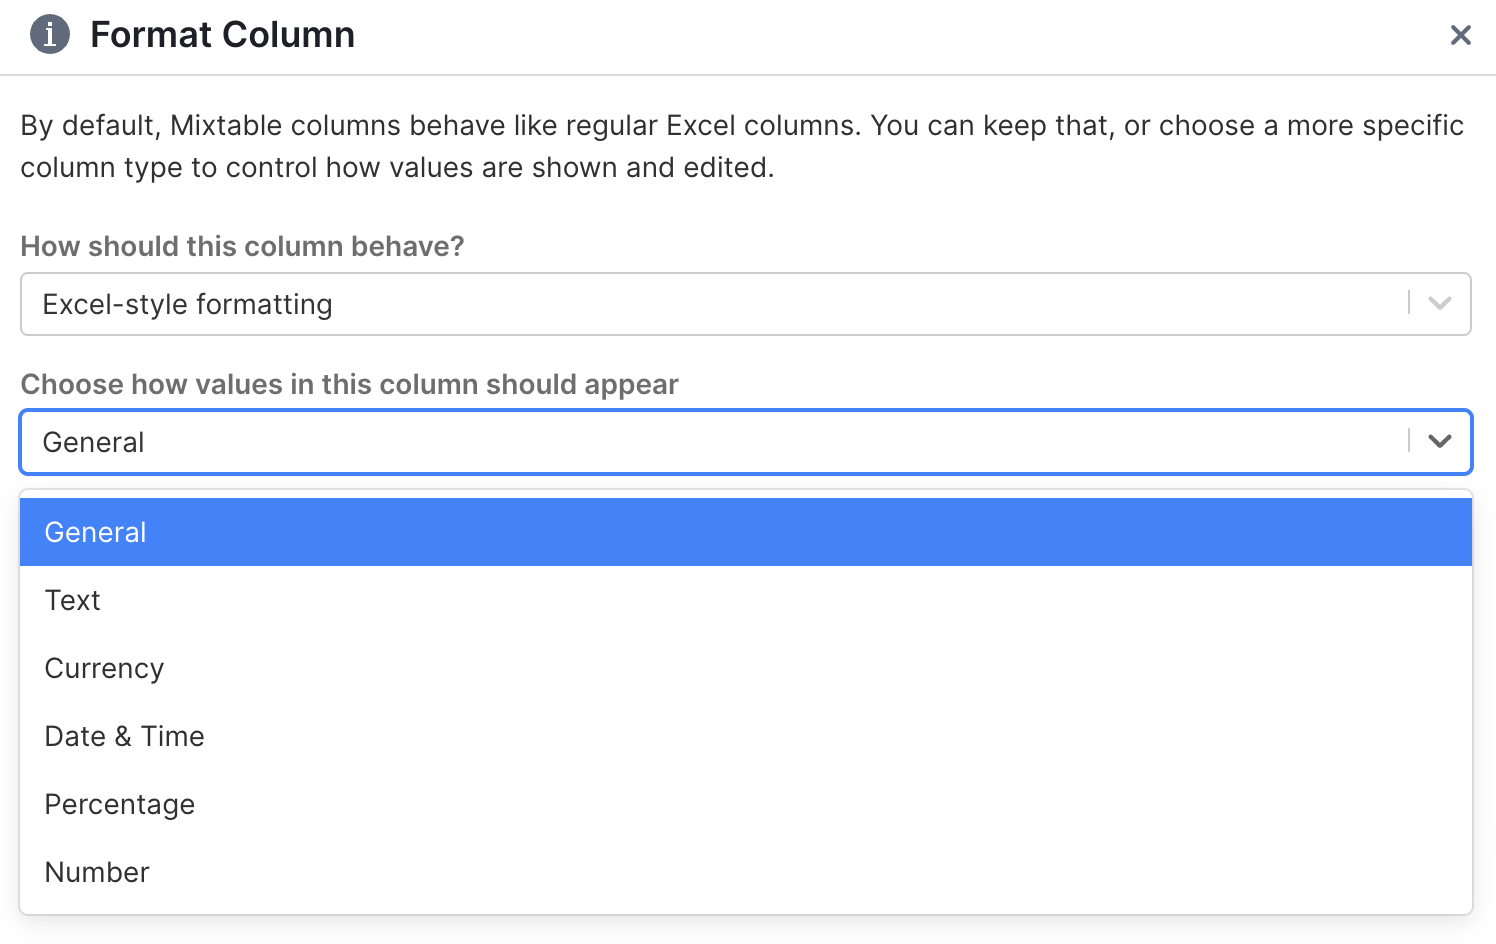
In the format column dialog, you’ll see a dropdown asking “How should this column behave?” with two main options:
When you choose Excel-style formatting, you can pick from these formats:
This is the default spreadsheet behavior. Mixtable displays values naturally and treats numbers as numbers, which keeps formulas, sorting, and filtering working smoothly.
Use General when you don’t need special formatting and want standard Excel-like behavior.
Text formatting treats everything as text, even if it looks like a number.
This is perfect for Shopify fields where you need to preserve the exact value you type, such as:
00123)#1001Currency formatting adds a currency symbol and keeps your decimal places consistent.
You can customize:
$, €, ¥, £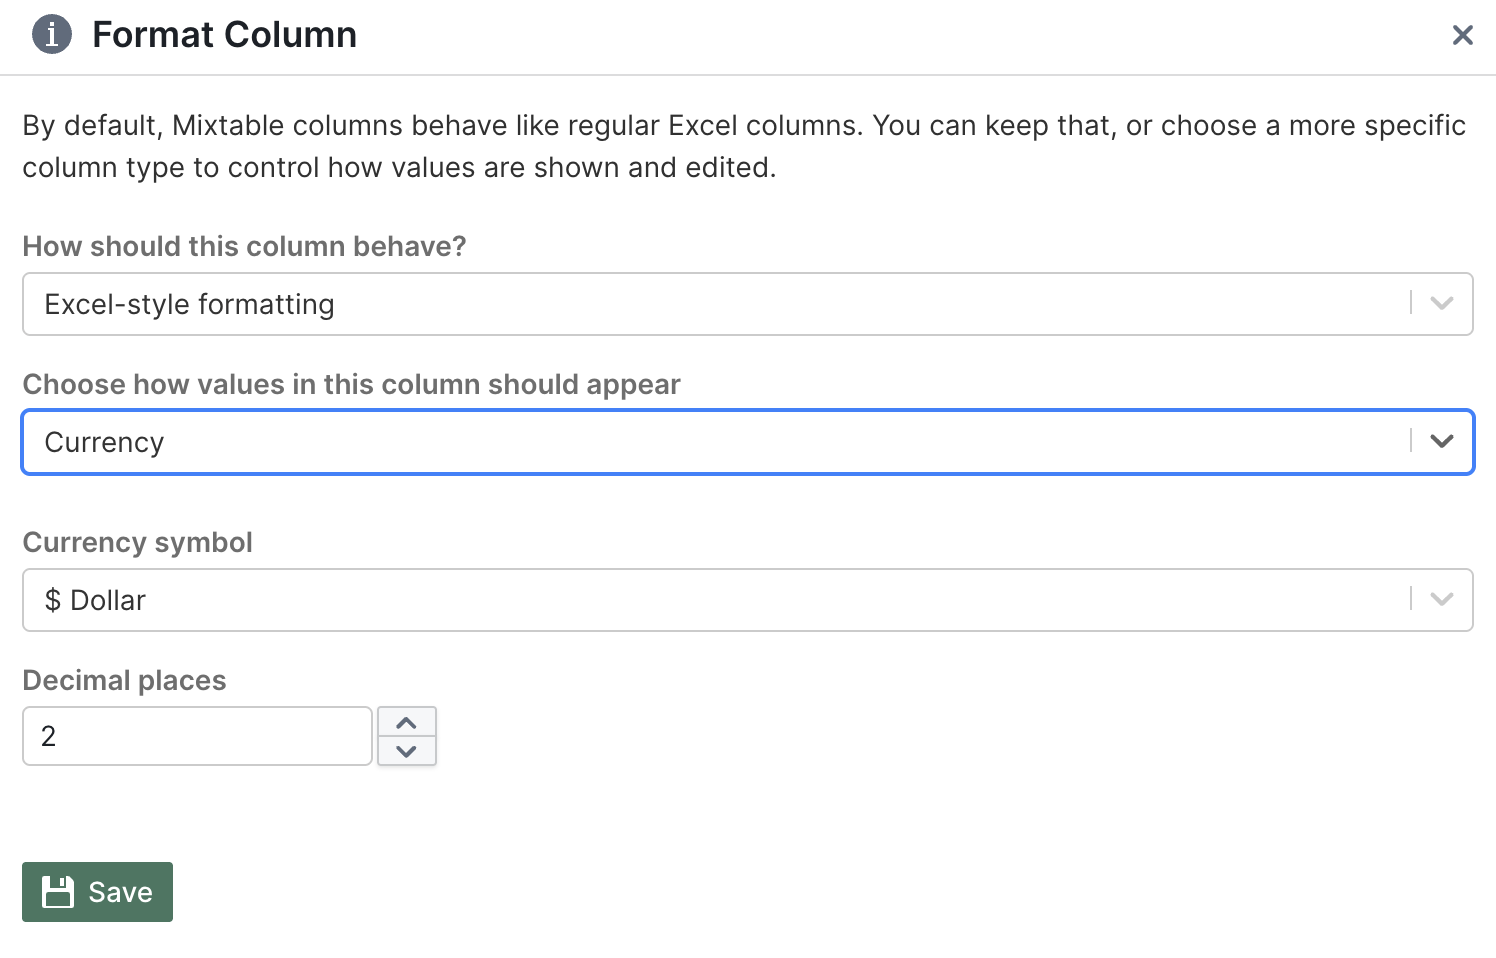
This is ideal for Shopify price columns, compare-at prices, product costs, and any other money-related fields.
Date & Time formatting displays values in a human-readable date or time format. Choose the format that matches how you or your team prefers to read dates.
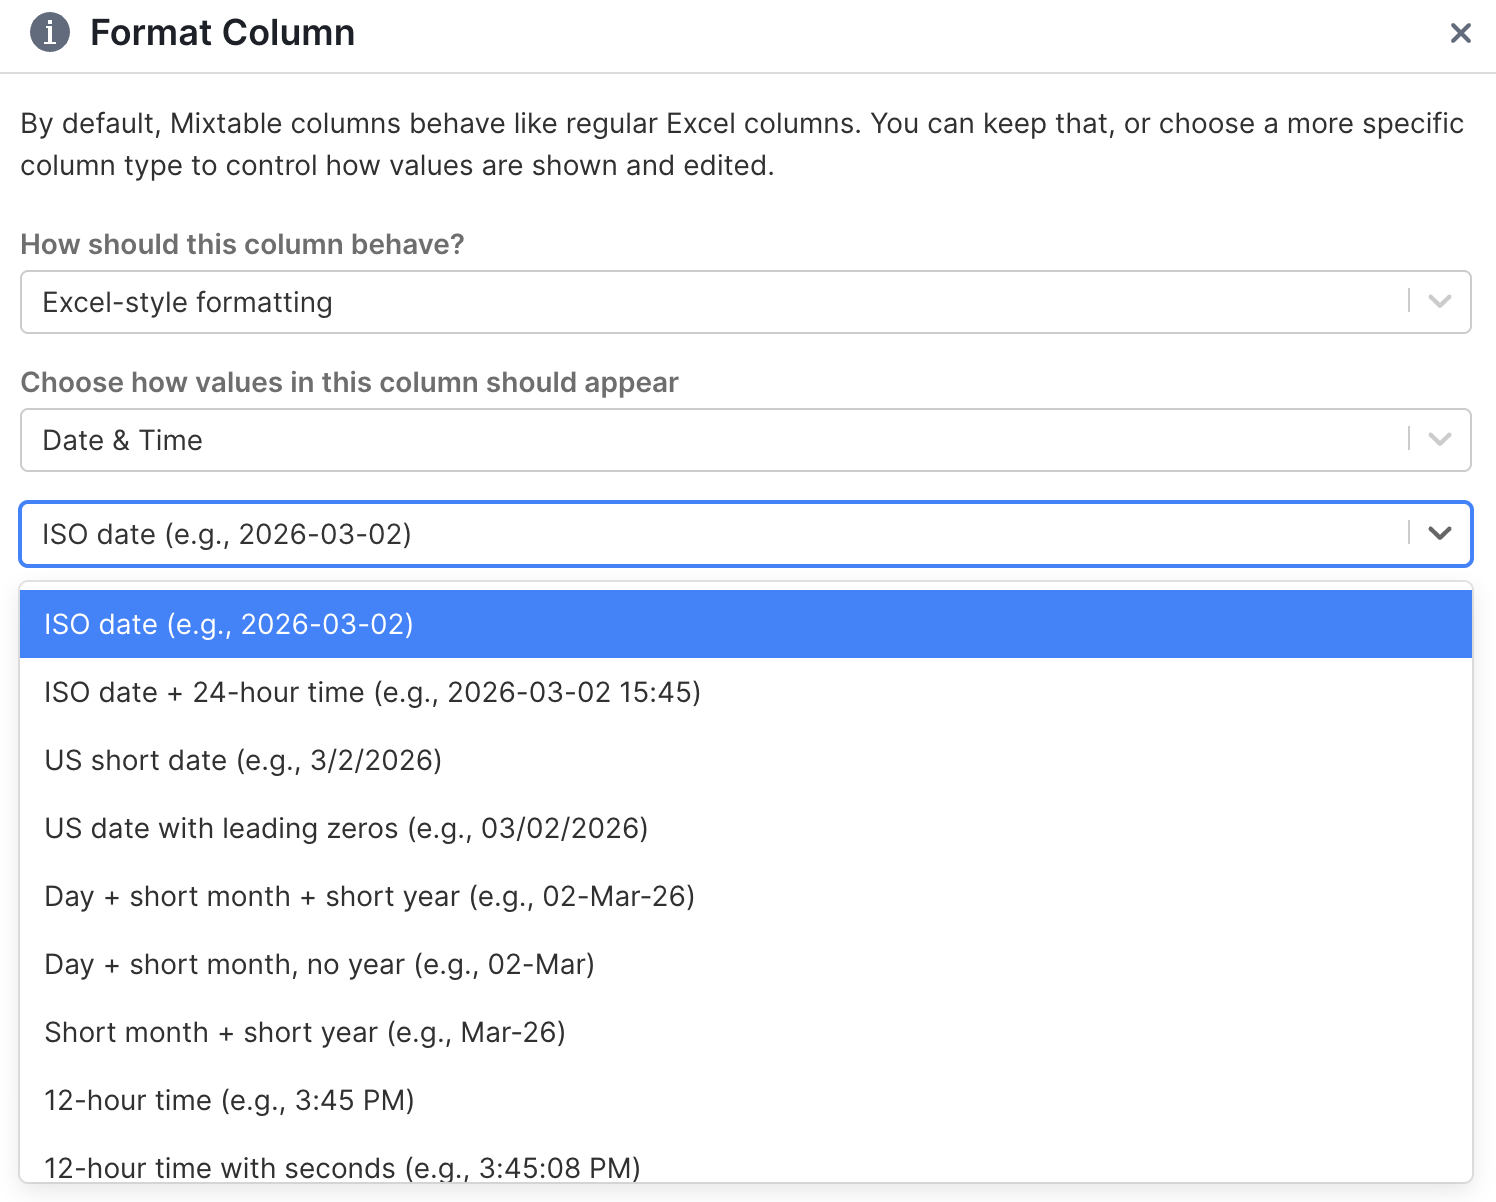
| Format | Example |
|---|---|
yyyy-mm-dd (ISO date) | 2026-03-02 |
m/d/yyyy (US short date) | 3/2/2026 |
mm/dd/yyyy (US date with leading zeros) | 03/02/2026 |
dd-mmm-yy | 02-Mar-26 |
dd-mmm | 02-Mar |
mmm-yy | Mar-26 |
| Format | Example |
|---|---|
yyyy-mm-dd hh:mm (ISO date + 24-hour time) | 2026-03-02 15 |
| Format | Example |
|---|---|
h:mm AM/PM | 3 PM |
h:mm:ss AM/PM | 3:45 PM |
hh:mm (24-hour) | 03 |
hh:mm:ss (24-hour with seconds) | 03:45 |
Use date formatting for Shopify fields like product creation dates, publish dates, or any custom date tracking columns in your workflow.
Percentage formatting shows numbers as percentages.
You can customize:
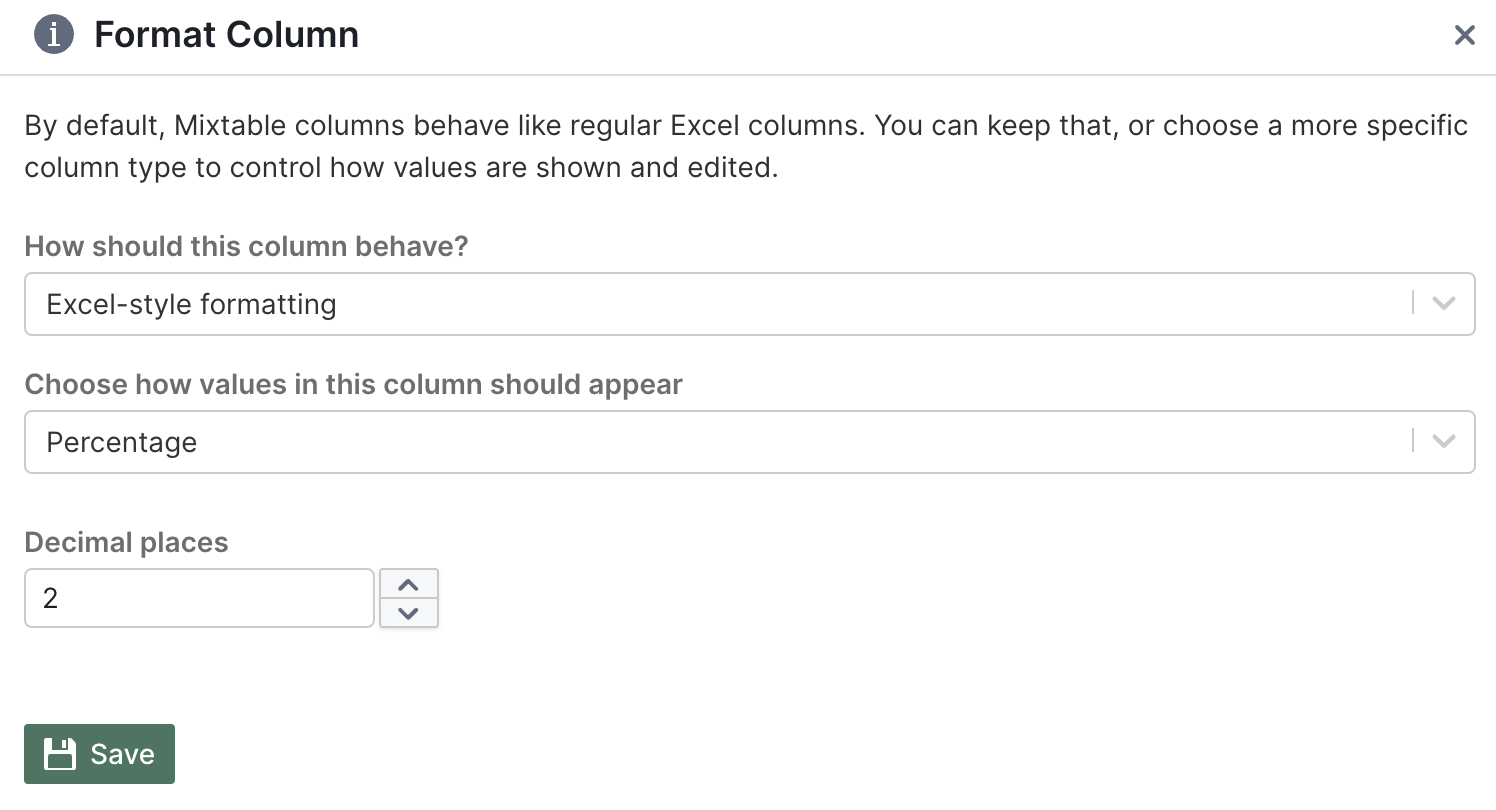
Tip: Percentages follow standard spreadsheet rules. For example, 0.25 displays as 25%. If you type 25, it will show as 2500%.
Number formatting displays values as numbers with optional thousand separators and consistent decimals.
You can customize:
1,000)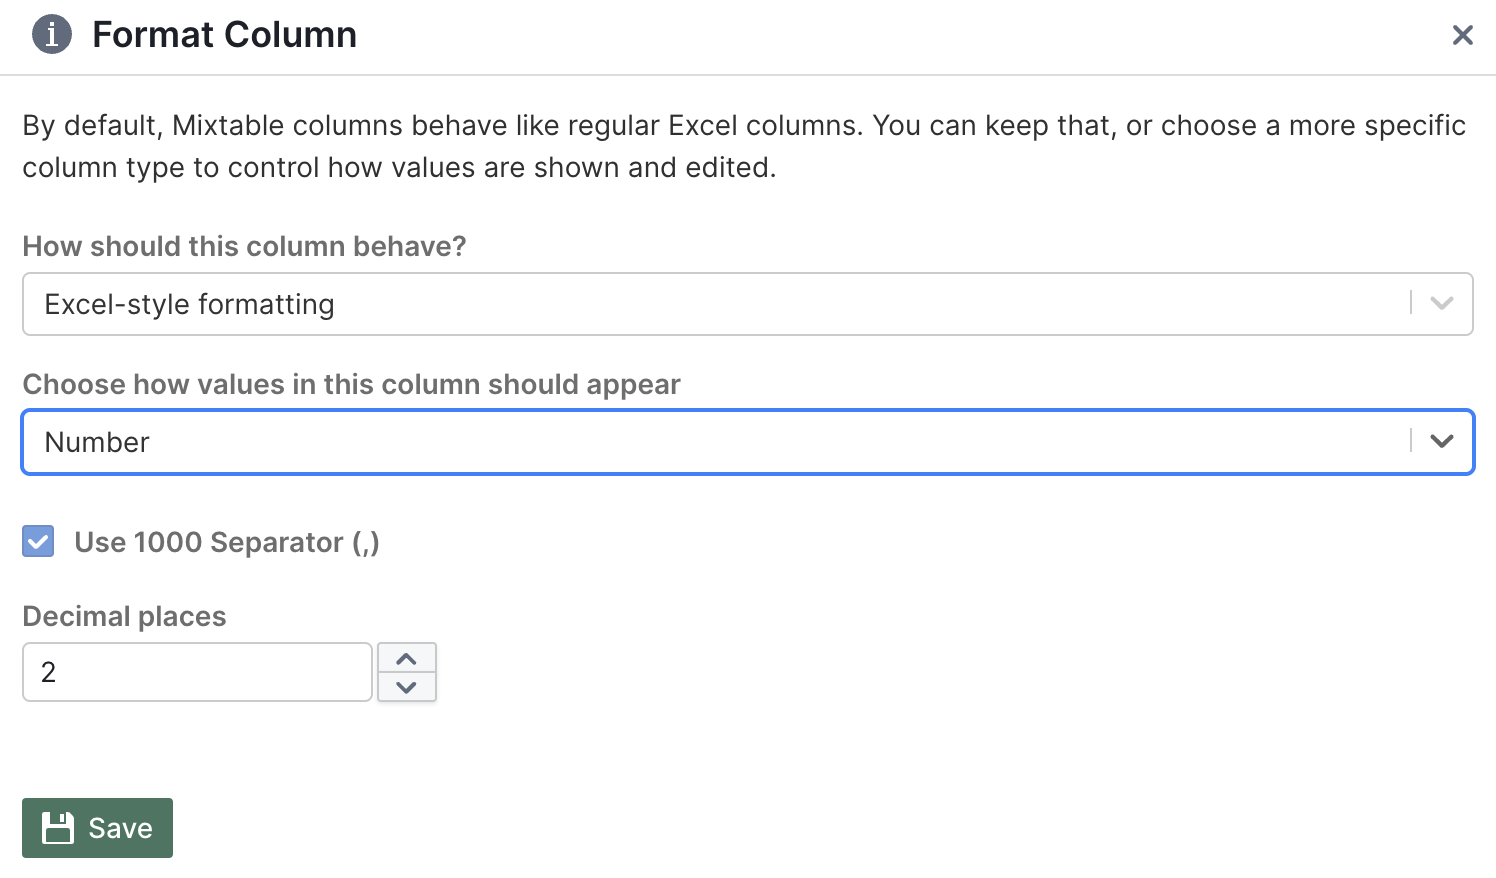
This works great for Shopify inventory quantities, units sold, order counts, and other numeric data.
When you choose Select / Dropdown, the column works like a picklist where you choose from predefined options.
You can set:
Dropdown columns are perfect for workflow tracking alongside your Shopify data, such as:
Needs review, Approved, Ready to syncDo not discount or Check imagesHere are some common formatting setups that work well:
yyyy-mm-dd for ISO, or mm/dd/yyyy for US-style)My formulas aren’t calculating correctly
If your column is formatted as Text, values get treated as text instead of numbers. Switch the format to General or Number to fix this.
My percentages look way too big
Make sure you’re using spreadsheet-style values. In spreadsheets, 0.25 equals 25%, not 25. If you type 25, it will display as 2500%.
You're ready!
Mixtable is an online spreadsheet designed to sync data with Shopify. It looks, feels, and behaves like Excel (including formulas), but runs in your browser. With Mixtable you can:
Best of all, you can sync changes back to Shopify with a single click. Find out more about the Mixtable suite of products here.